My last post is about places students can get publicly available data. I promised to talk about the tools we can use to access it. This post will be about with the tools that are out there now.
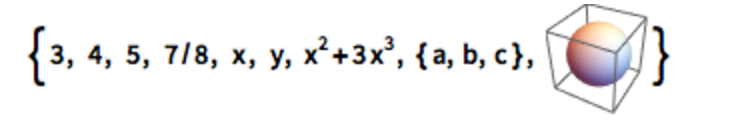
Probably the gold standard right now for getting at real data and doing stuff with it is the Wolfram Language. There is a lot to recommend this, but the biggest one is the enormous amount of data the WL puts at your fingertips. Also the wide amount of data types the language can access and work with, including things like colors, countries, shapes, images and all kinds of other things I probably haven’t tried yet. WL is entirely comfortable with an array that looks like this:
Wolfram language also allows a fantastic range of visual outputs, from 2d and 3d graphs, colored maps, graphs of functions with sliders you can manipulate, interfaces with buttons and probably a bunch of other things I haven’t tried yet. Furthermore it’s extremely easy to use, so almost anyone can look through the documentation and start typing things in to see what happens. And it connects to a lot of other APIs, like Facebook’s.
But some of these strengths are also weaknesses when your goal is to teach coding. Wolfram’s radical leniency with data types will teach your students terrible coding habits that will lead to real problems in other languages. The wide range of different kinds of output the language is capable of makes it really hard to predict what kind of output you’re going to get from a program. And though I haven’t tried it, Wolfram doesn’t seem to be set up for long complex functions. There’s not even a local development environment where a person can edit and save their programs. As a result, I think that WL is a terrific tool for teaching pretty much any subject except for programming. The one exception is if you’re preparing students to learn a functional language like Haskell, since WL is also purely functional, calling functions in a similar way and lacking things that most people expect to see in a programming language, like loops.
The two most popular tools for data manipulation in the scientific world seem to me to be Python and R. Python is a great learning language because it’s really easy to do a lot of things and there are countless modules that can do just about anything. But in spite of its ease relative to other programming languages, it still takes awhile before a student can do much. You have to spend about a semester’s worth of writing console programs before you will be ready to do any kind of graphics, and that’s enough time to lose a student who isn’t naturally attracted to coding. But a well-designed class could have students doing interesting things with data pretty soon.
I don’t know much about R. I know that professional statisticians really like it and professional programmers mostly don’t. I don’t think it has a shallow learning curve. I imagine if you wanted to take the time to teach it you could have students doing some interesting things but from what I know it’s a better tool for teaching statistics than for teaching programming.
So what’s the right tool? I think the ideal tool doesn’t exist…yet. But I have a vision in my head of what it would look like. It would be as accessible as something like Greenfoot or NetBeans, with a low scaffold for beginners. It would allow you to manipulate data as easily as a Python module, though maybe not as easily as WL. It would have tools to create graphics of different sorts. And it would have access to a wide range of open source data, with menus to choose it, though with more precision about types than WL. Ideally you’d be able to import data into SQL-type tables (or maybe JSON or XML objects), and manipulate them with either the SQL language or a functional tool like C#’s LINQ.
The tool I’m imagining is the holy grail of this blog right now. If it existed, I’d be using it now. If it continues to not exist…I might have to try to make it.